USDJPY LOSS

USDJPY LOSS
19th December 2017 contacttf
The Ichimoku Cloud is an indicator designed to tell you everything you need to know about a price trend, including its direction, momentum, dynamic support and resistance levels, and even trade signals. The Japanese name—Ichimoku Kinko Hyo—means “one look (or glance) equilibrium chart.”

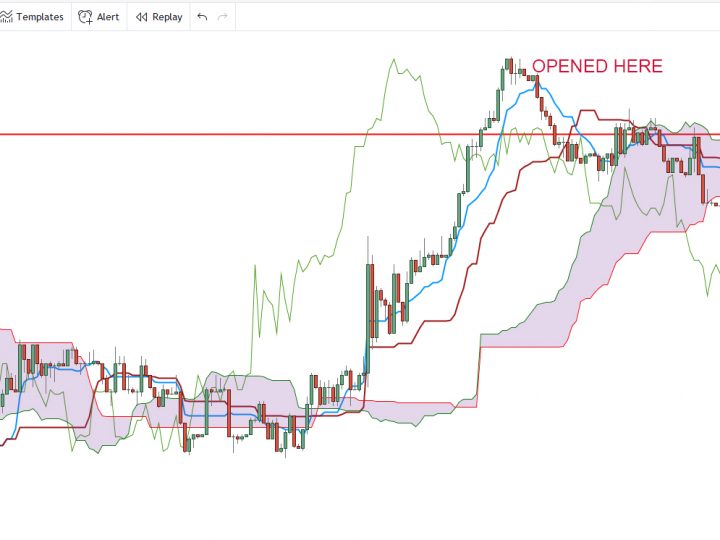
After the previous breakeven, I got back in again.

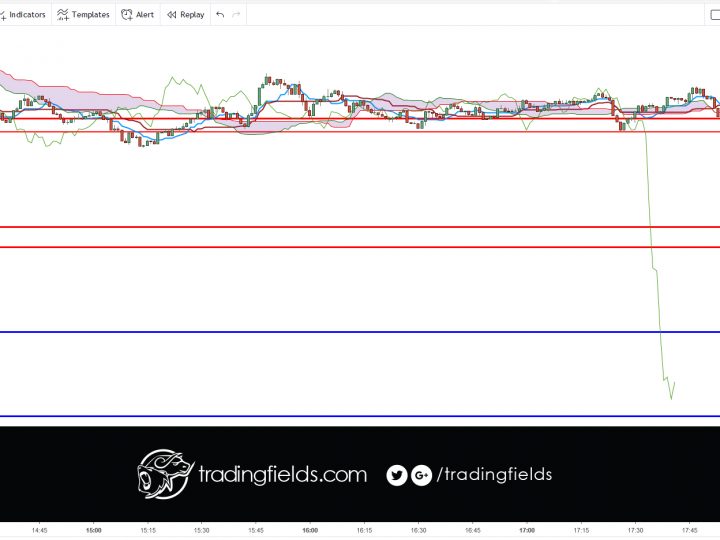
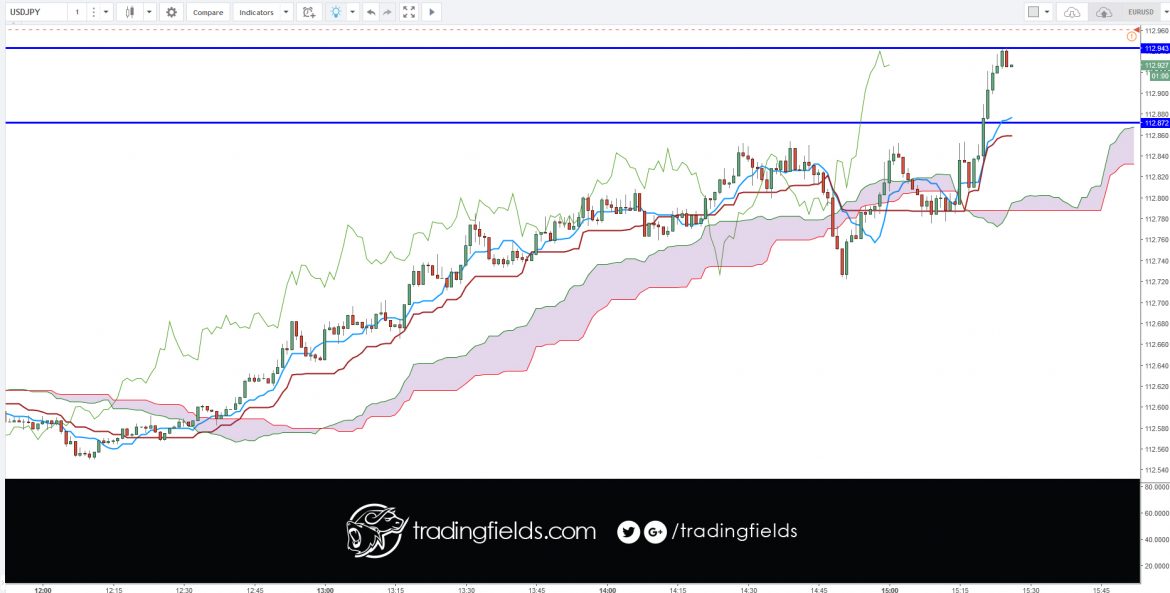
There were 2 resistance points on the 15 min chart. I used the highest of the 2.

Trade did not work, I am unsure why this is. The outlook was positive overall.

Note to self, I need to be  more vigilant when looking at RSI data.

The relative strength index (RSI) is most commonly used to indicate temporary overbought or oversold conditions in a market. An intraday forex trading strategy can be devised to take advantage of indications from the RSI that a market is overextended and therefore likely to retrace.

0 Comments

Leave a reply

Your email address will not be published. Required fields are marked *

*