USDCHF LOSS

USDCHF LOSS
14th December 2017 contacttf
The Relative Strength Index (RSI), developed by J. Welles Wilder, is a momentum oscillator that measures the speed and change of price movements. The RSI oscillates between zero and 100. Traditionally the RSI is considered overbought when above 70 and oversold when below 30.

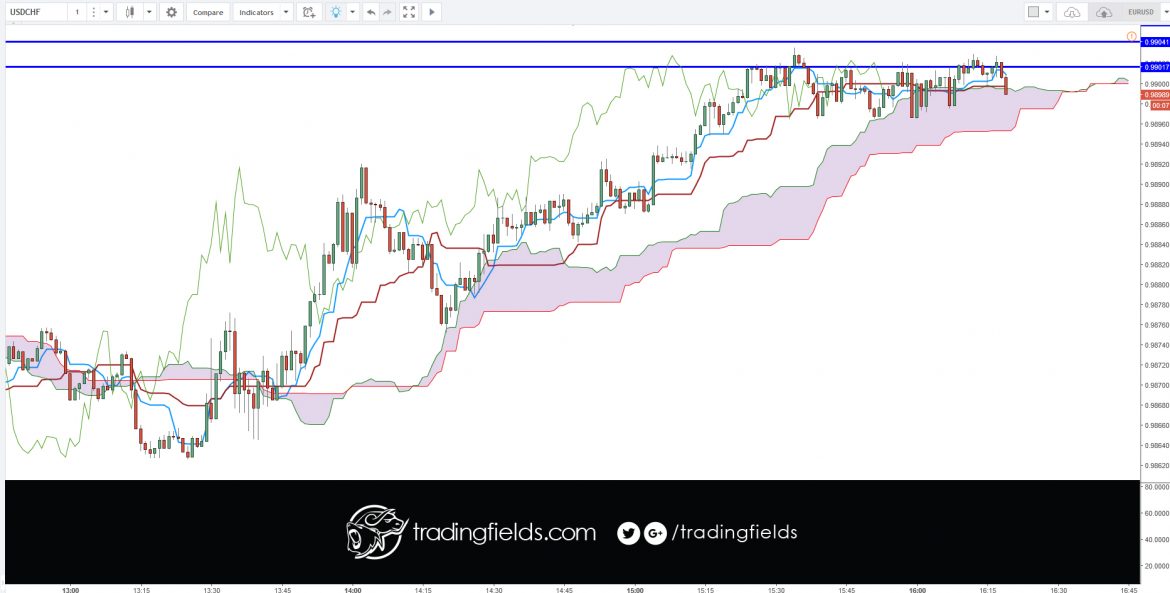
3 areas of resistance were drafted.

Price immediately dropped. I did have the opportunity to close for profit, at this point.

I let the trade run through to breakeven.

Needing to leave my desk, my stop was at the 2nd resistance 0.99041. I felt there was good risk/reward value.

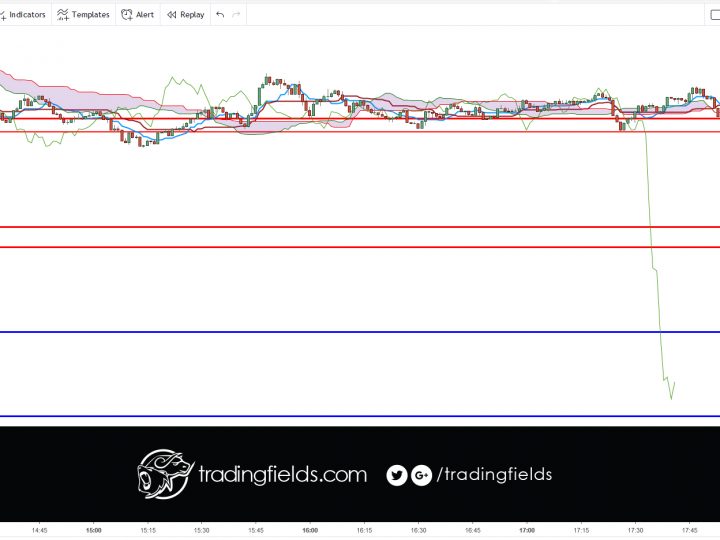
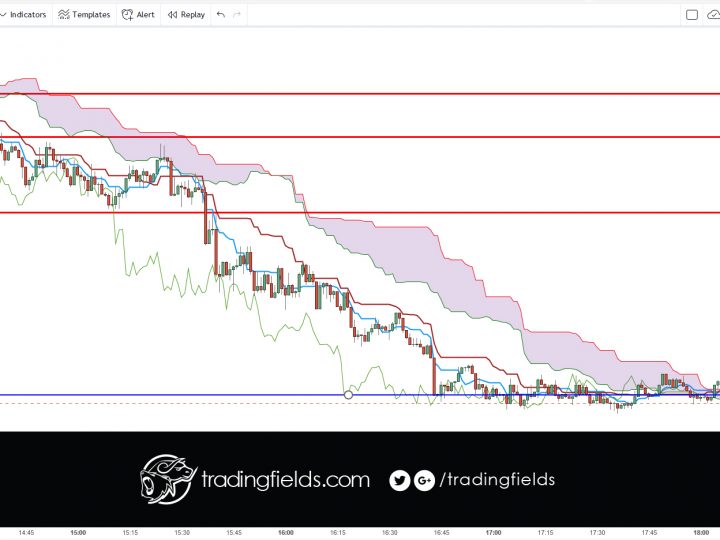
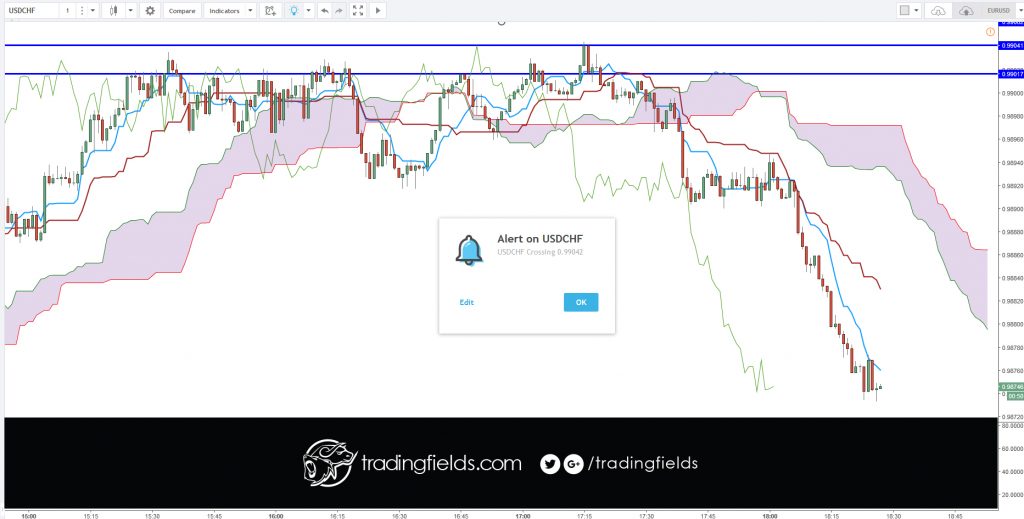
Trade hit my stop and nose dive thereafter.

I am not disappointed though, just look at this chart below. My call was correct.
This is the midpoint between the Conversion Line and the Base Line.  The Leading Span A forms one of the two Cloud boundaries. It is  referred to as "Leading" because it is plotted 26 periods in the future and forms the faster Cloud boundary.


0 Comments

Leave a reply

Your email address will not be published. Required fields are marked *

*