USDCAD PROFIT

USDCAD PROFIT
4th January 2019 contacttf
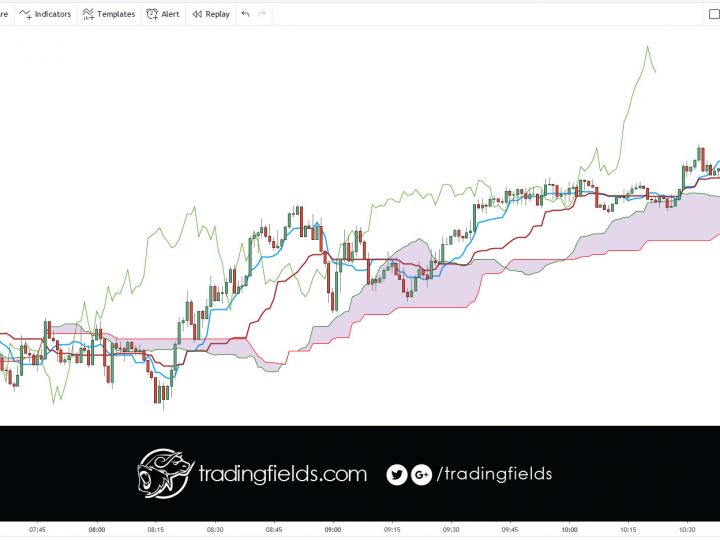
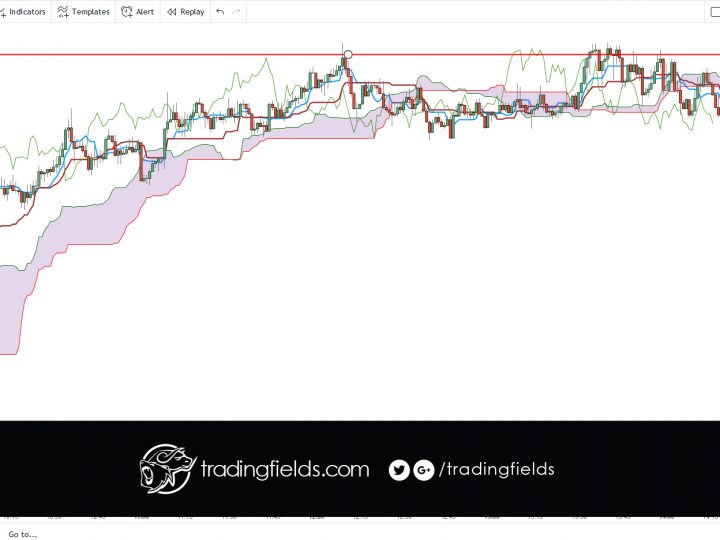
On the daily chart, this line is the mid point of the 52 day high-low range, which is a little less than 3 months. The default calculation setting is 52 periods, but can be adjusted. This value is plotted 26 periods in the future and forms the slower Cloud boundary.

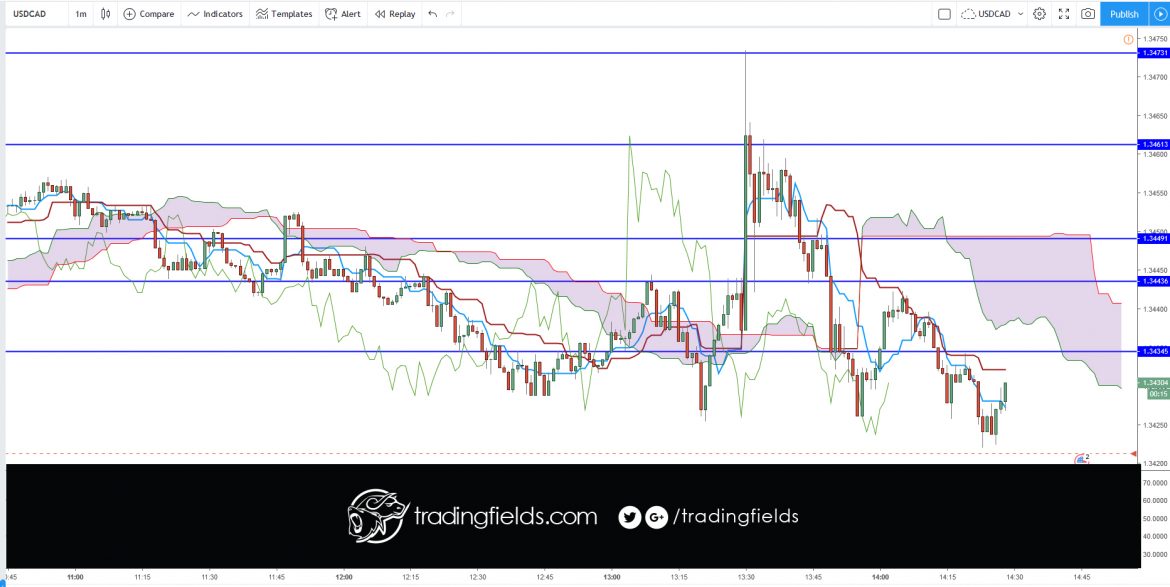
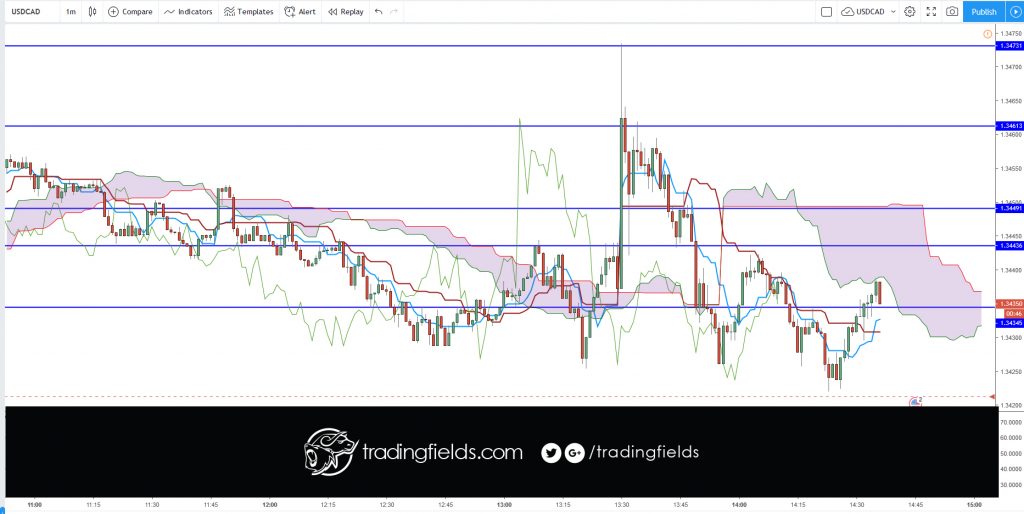
I took another punt at USDCAD, but again I did not follow my strategy.

  1. I was unable to draft a support area.
  2. The support lines above were now resistance.
  3. We are expecting plenty of news in the next few hours, so needed to be more cautious.

Trade closed at the earliest opportunity. I feel lucky to get out with a little bit of profit.
This is the midpoint between the Conversion Line and the Base Line.  The Leading Span A forms one of the two Cloud boundaries. It is  referred to as "Leading" because it is plotted 26 periods in the future and forms the faster Cloud boundary.


0 Comments

Leave a reply

Your email address will not be published. Required fields are marked *

*