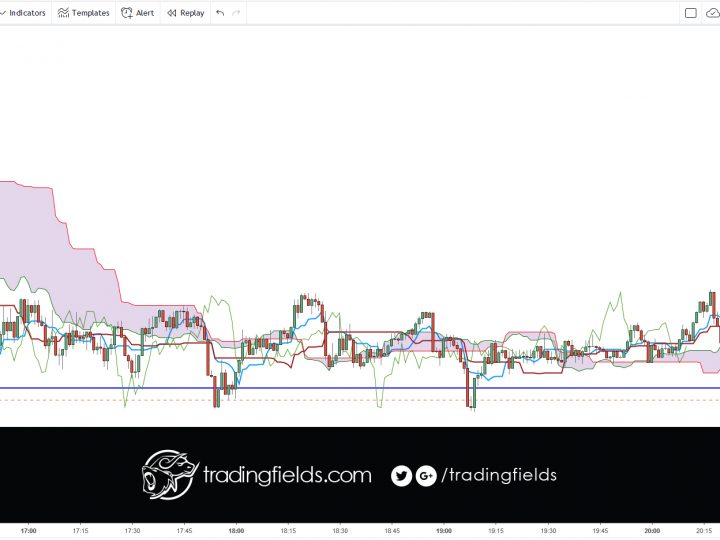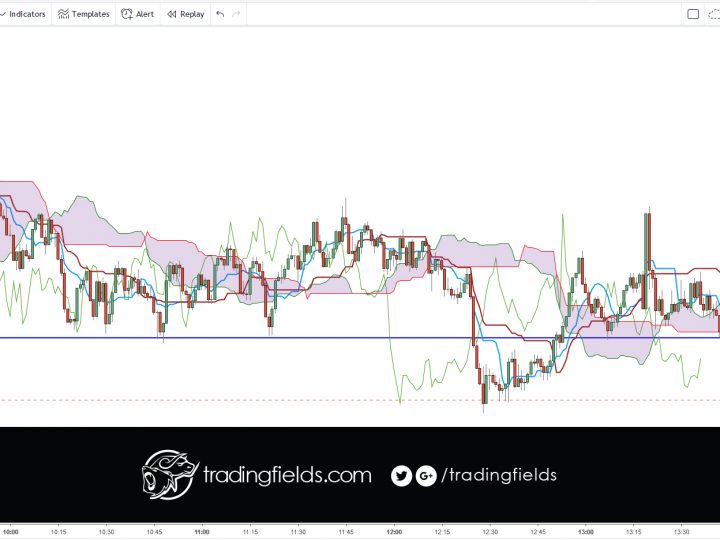
GBPJPY BREAKEVEN

GBPJPY BREAKEVEN
18th October 2017 contacttf
(52-period high + 52-period low)/2)) On the daily chart, this line is the mid point of the 52 day high-low range, which is a little less than 3 months. The default calculation setting is 52 periods, but can be adjusted. This value is plotted 26 periods in the future and forms the slower Cloud boundary.

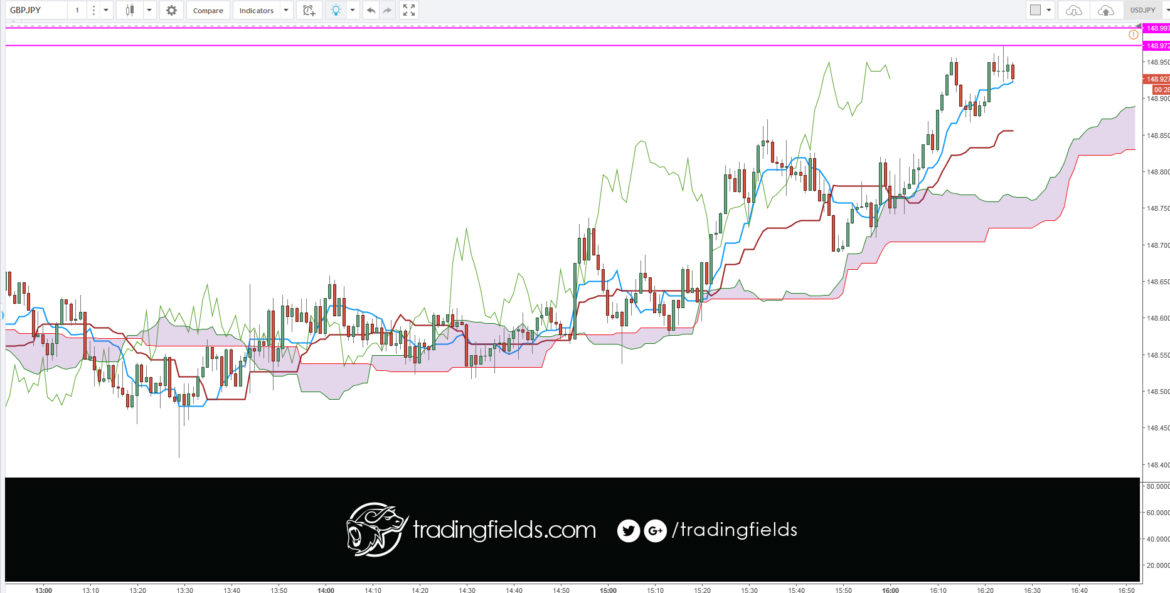
I used the resistance from the candle charts. Unlike the Ichimoku cloud resistance, the depth of resistance can be between the body and the top of the wick.

In this instance you will see 2 lines, showing this area.

Trade entry was made, just below resistance.

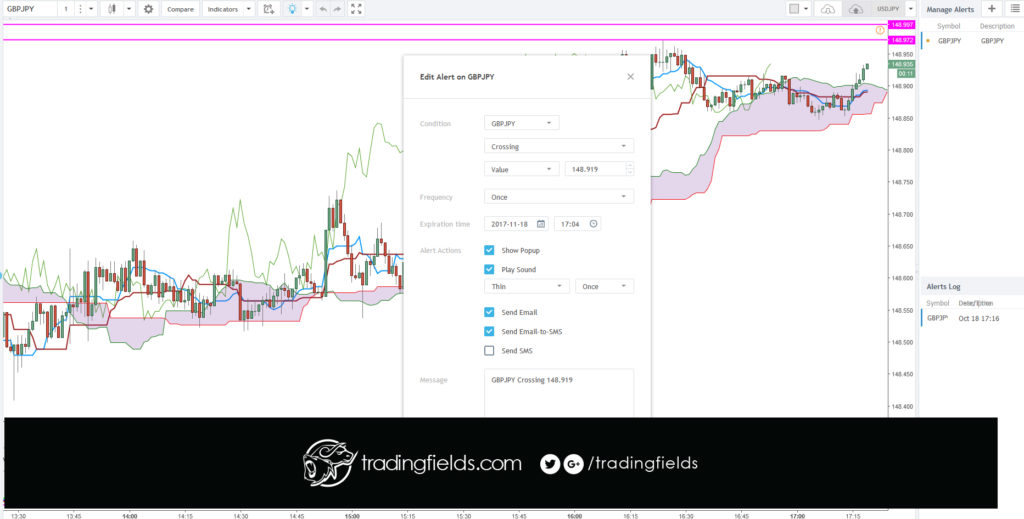
I was leaving the desk, so I could not oversee a manual trade exit. Stop was moved to breakeven, which triggered shortly after I left my computer.

I accidentally closed the ‘stop’ pop up. The close details are shown below for transparency.
The Relative Strength Index (RSI), developed by J. Welles Wilder, is a momentum oscillator that measures the speed and change of price movements. The RSI oscillates between zero and 100. Traditionally the RSI is considered overbought when above 70 and oversold when below 30.

0 Comments

Leave a reply

Your email address will not be published. Required fields are marked *

*