Epic loss 14.07.2016 [Stopped Out]

Epic loss 14.07.2016 [Stopped Out]
14th July 2016 contacttf
The Ichimoku Cloud, also known as Ichimoku Kinko Hyo, is a versatile indicator that defines support and resistance, identifies trend direction, gauges momentum and provides trading signals. Ichimoku Kinko Hyo translates into “one look equilibrium chart”. With one look, chartists can identify the trend and look for potential signals within that trend.

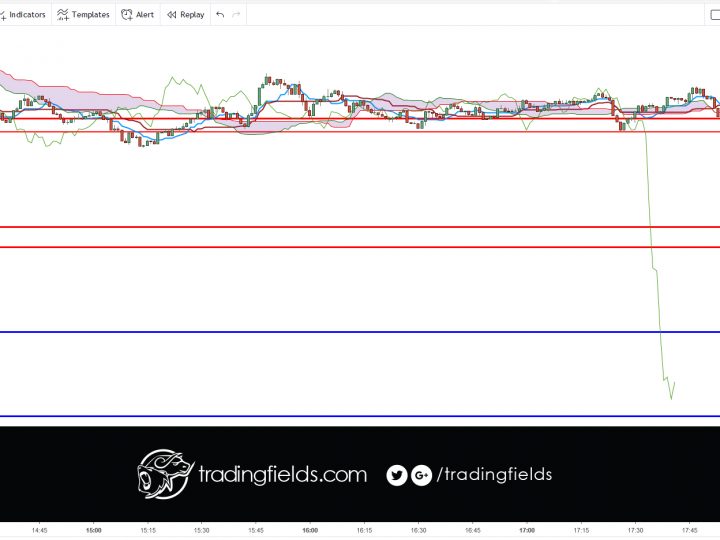
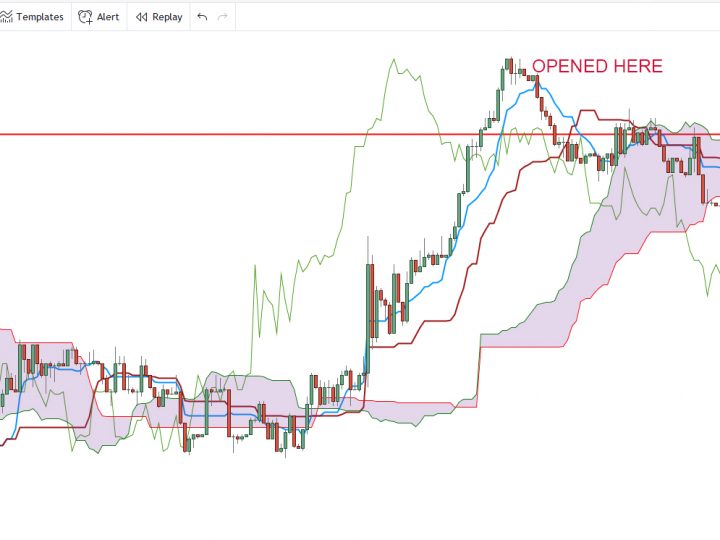
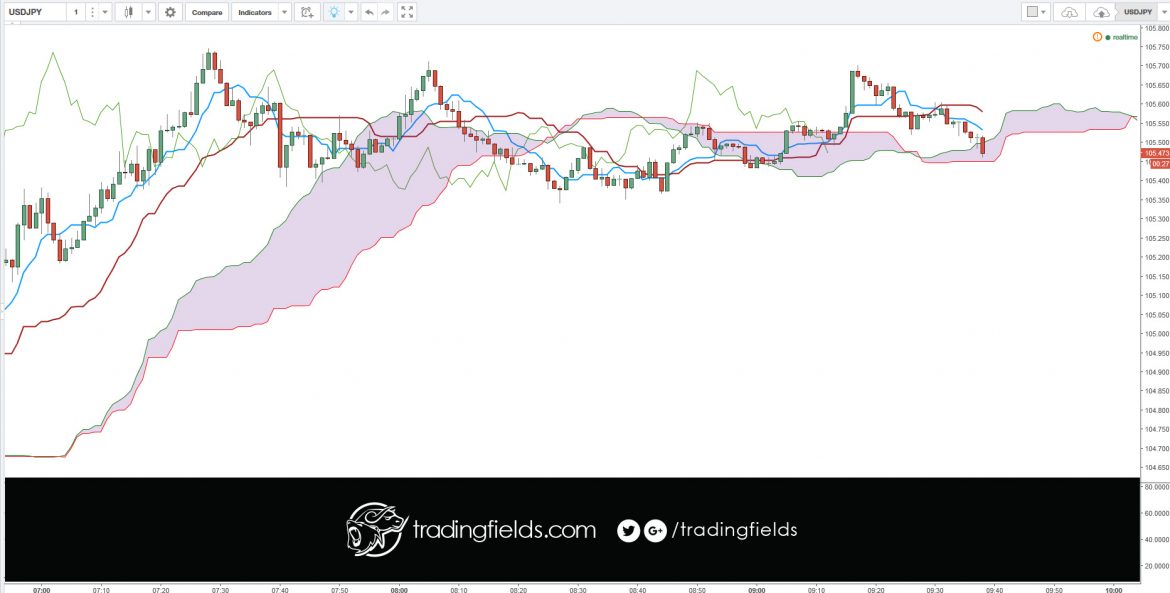
I trade did not work for me today. My entry looked suspect. The Sen turn was not quite perfect. Biggest USDJPY loss to date.

Also, I should have been aware of the 106.00 round number. Most automated system gun for these.

USDJPY STOPED OUT. LOSS 105.473 > 105.688 [-0.215]

The indicator was developed by Goichi Hosoda, a journalist, and published in his 1969 book. Even though the Ichimoku Cloud may seem complicated when viewed on the price chart, it is really a straight forward indicator that is very usable. It was, after all, created by a journalist, not a rocket scientist! Moreover, the concepts are easy to understand and the signals are well-defined.

Note to self: RSI was not tight on the 1 hr chart. Pink RSI was floating

0 Comments

Leave a reply

Your email address will not be published. Required fields are marked *

*