Author archive for contacttf

  • The Relative Strength Index (RSI), developed by J. Welles Wilder, is a momentum oscillator that measures the speed and change of price movements. The RSI oscillates between zero and 100. Traditionally the RSI is considered overbought when above 70 and oversold when below 30.

    USDCHF LOSS

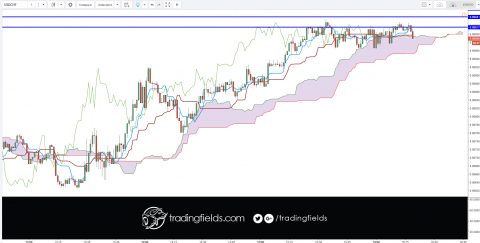
    3 areas of resistance were drafted. Price immediately dropped. I did have the opportunity to close for profit, at this…

    by
  • #forexlife #forexquote #xm #stacking #forextrading #motivation #success #entrepreneur #daytrading #inspiration #technicalanalysis #success #trading #daytrading #motivation #entrepreneur #technicalanalysis #investment #dollar #stock #market #economy

    EURGBP LOSS

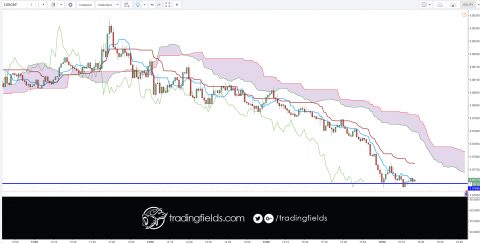
    The support was drafted using the 2 hour chart. I was out almost instantly. I was unable to upload my…

    by
  • EURUSD BREAKEVEN. I was getting really emotional with these trades. I just could not understand the flow of the price patterns. I am happy to be out, although it feels like a loss. $eurusd #forex #forexalert #forexshare #forexcharts

    EURUSD BREAKEVEN

    I took another entry, this was my 3rd. Trade manually closed, as soon as price popped back up. I was…

    by
  • rich #trade #inspiration #binaryoptions #dollar #euro #investor #gbpusd #investing #billionaire #technicalanalysis #markets #usdjpy #metatrader #usd #london #foreignexchange #futures #forexmarket

    EURUSD LOSS

    I got back in after price went down to my second support line. Trade did not work again. I think…

    by
  • The foreign exchange market (Forex, FX, or currency market) is a global decentralized or Over The Counter (OTC) market for the trading of currencies. This includes all aspects of buying, selling and exchanging currencies at current or determined prices.

    EURUSD LOSS

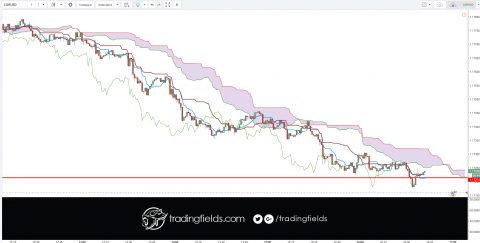
    The support was drafted from the 2 hour chart. I missed the initial 1 min jump, price came back down…

    by
  • The relative strength index (RSI) is most commonly used to indicate temporary overbought or oversold conditions in a market. An intraday forex trading strategy can be devised to take advantage of indications from the RSI that a market is overextended and therefore likely to retrace.

    GBPJPY LOSS

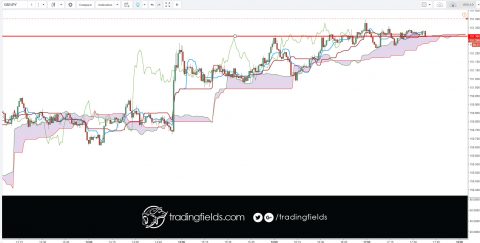
    I got back into the same trade again.The cloud looked favorable. I was expecting price to drop below resistance quickly.…

    by
  • The Relative Strength Index (RSI), developed by J. Welles Wilder, is a momentum oscillator that measures the speed and change of price movements. The RSI oscillates between zero and 100. Traditionally the RSI is considered overbought when above 70 and oversold when below 30.

    GBPJPY LOSS

    My trade entry was based on the resistance using the 15 min chart. Trade did not work as expected. The…

    by
  • #rich #trade #inspiration #binaryoptions #dollar #euro #investor #gbpusd #investing #billionaire #technicalanalysis #markets #usdjpy #metatrader #usd #london #foreignexchange #futures #forexmarket #cash #forexgt

    USDCAD PROFIT

    I had 3 pre drawn resistance areas using the 15 min chart. My entry was in between 2 resistance zones,…

    by
  • The Chikou span is the lagging indicator component of the Ichimoku Kinko Hyo candlestick trading model. The Chikou is a line of the most recent price action, but it is plotted 26 trading periods into the past. Chikou spans are designed to allow traders to visualize the relationship between current and prior trends.

    USDCHF BREAKEVEN

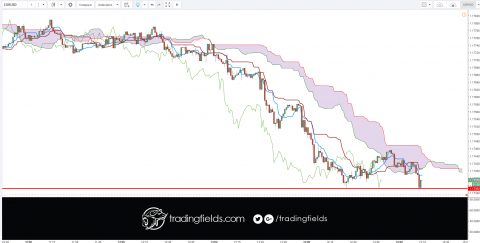
    USDCHF had been on my watch list for some time. The resistance drafted from the 1 hour chart was too…

    by
  • The relative strength index (RSI) is most commonly used to indicate temporary overbought or oversold conditions in a market. An intraday forex trading strategy can be devised to take advantage of indications from the RSI that a market is overextended and therefore likely to retrace.

    EURUSD LOSS

    I got back in again. My outlook was the same, go long near the support line. Unfortunately, trade did not…

    by