Author archive for contacttf

  • The term

    USDCHF LOSS

    I got back into this pair again after some recent losses. In hindsight, I should have waited for reaction in…

    by
  • The relative strength index (RSI) is most commonly used to indicate temporary overbought or oversold conditions in a market. An intraday forex trading strategy can be devised to take advantage of indications from the RSI that a market is overextended and therefore likely to retrace.

    USDCHF LOSS

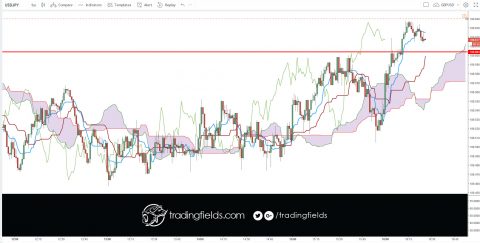
    I got back in again because there is a very good chance for a big drop. The USD data at…

    by
  • The Relative Strength Index (RSI), developed by J. Welles Wilder, is a momentum oscillator that measures the speed and change of price movements. The RSI oscillates between zero and 100. Traditionally the RSI is considered overbought when above 70 and oversold when below 30.

    USDCHF LOSS

    The charts look good all the way to the 4 hour chart. The 1 min was not ideal. I took…

    by
  • The relative strength index (RSI) is most commonly used to indicate temporary overbought or oversold conditions in a market. An intraday forex trading strategy can be devised to take advantage of indications from the RSI that a market is overextended and therefore likely to retrace.

    EURCHF LOSS

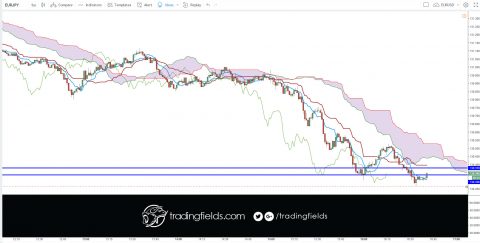
    On reflection the trade and the opening was never there. The 15 min chart was not ideally positioned. I was…

    by
  • In the forex market, think of money as a commodity, you are buying a currency hoping that its value will increase, and if you are selling you are betting that it will decrease. ... Instead the forex market is an interbank market, which means it's all connected together in a network of banks and institutions.

    USDJPY PROFIT

    The price has been moving sideways all the way until the 2 hour chart. Price overshot my resistance point, but…

    by
  • USDJPY LOSS

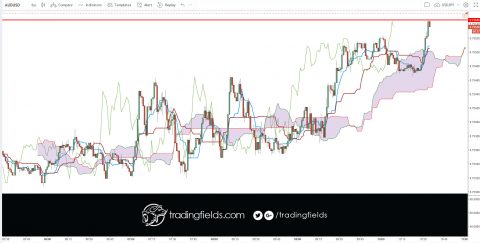
    This was an interesting setup. My vision was to run with the price momentum, but there was a small blip…

    by
  • The Relative Strength Index (RSI), developed by J. Welles Wilder, is a momentum oscillator that measures the speed and change of price movements. The RSI oscillates between zero and 100. Traditionally the RSI is considered overbought when above 70 and oversold when below 30.

    AUDUSD LOSS

    The 1 hour chart was bullish, so my thoughts were that I may be able to get some quick price…

    by
  • The Ichimoku Cloud, also known as Ichimoku Kinko Hyo, is a versatile indicator that defines support and resistance, identifies trend direction, gauges momentum and provides trading signals. Ichimoku Kinko Hyo translates into “one look equilibrium chart”.

    USDCAD LOSS

    I looked through all my pairs, but there is not much in the way of trade opportunities. I took the…

    by
  • DEFINITION of 'Tenkan-Sen' The mid-point between the highest high and lowest low of a particular security calculated over the past nine periods. The Tenkan-Sen line is the conversion line used specifically in the Ichimoku Kinko Hyo (or Ichimoku Cloud) equilibrium charts.

    EURJPY PROFIT

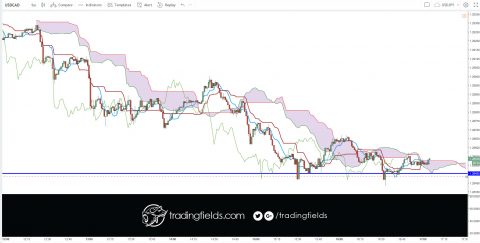
    I was fully aware of the losing again. The second trade had more barriers. We are looking two support lines,…

    by
  • The Chikou span is the lagging indicator component of the Ichimoku Kinko Hyo candlestick trading model. The Chikou is a line of the most recent price action, but it is plotted 26 trading periods into the past. Chikou spans are designed to allow traders to visualize the relationship between current and prior trends.

    EURJPY LOSS

    Charts look good all the way to the 3 hour chart. Two supports lines drafted means, I need a valid…

    by