USDCAD PROFIT

USDCAD PROFIT
13th November 2018 contacttf
The Relative Strength Index (RSI), developed by J. Welles Wilder, is a momentum oscillator that measures the speed and change of price movements. The RSI oscillates between zero and 100. Traditionally the RSI is considered overbought when above 70 and oversold when below 30.

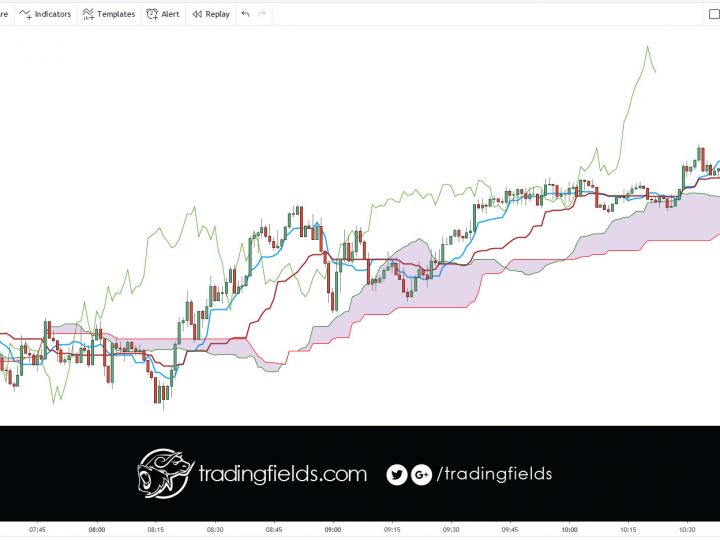
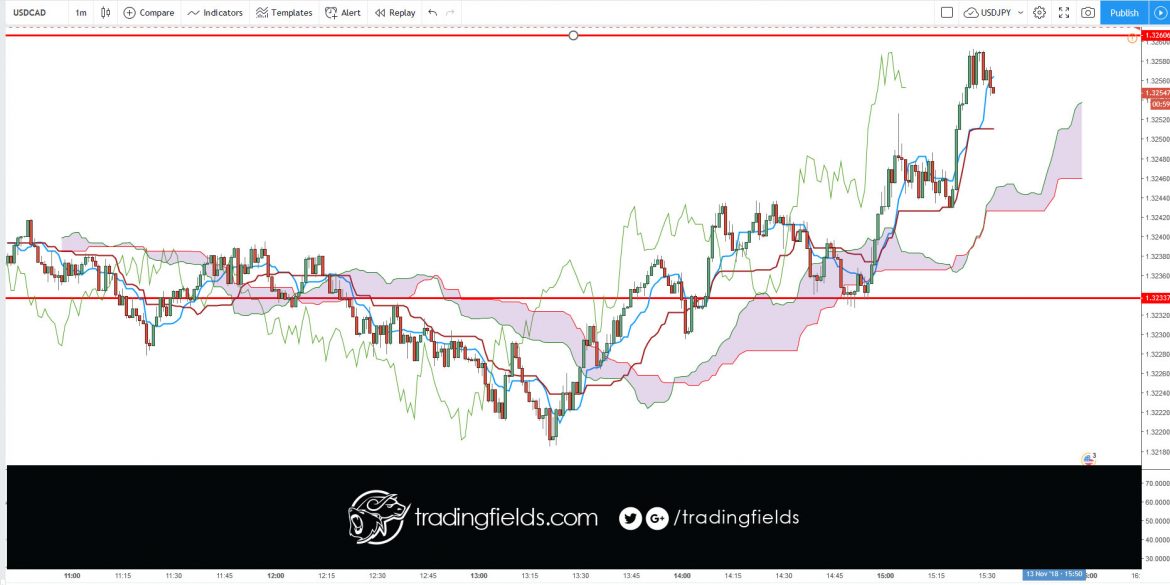
This was possibly my best trade ever. The timing of the near perfect entry/exit was awesome.

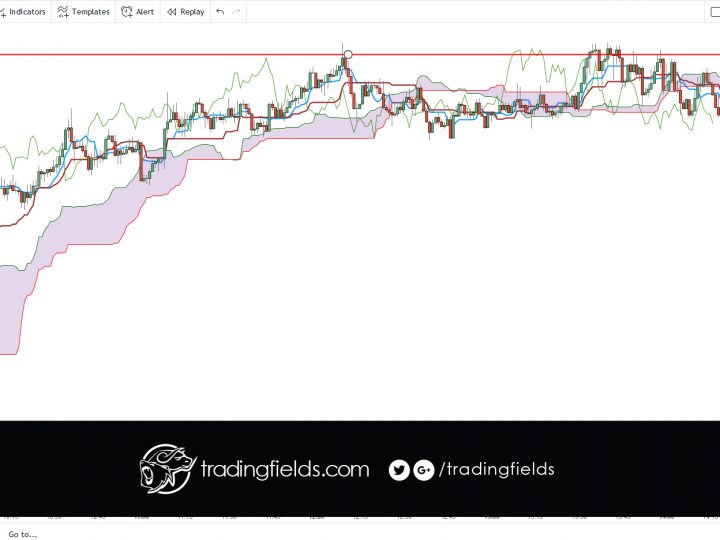
It’s price was floating around my pre-drawn resistance line. I decided to get in after being alerted by my new, Free App (Here).

USDCAD was in a channel, shortly after getting in. This may have happened because of the 16:00 GMT news.

I held onto my position, and successfully seen my strategy through to the end using the RSI Red on the 1 min chart.

The Chikou span is the lagging indicator component of the Ichimoku Kinko Hyo candlestick trading model. The Chikou is a line of the most recent price action, but it is plotted 26 trading periods into the past. Chikou spans are designed to allow traders to visualize the relationship between current and prior trends.


0 Comments

Leave a reply

Your email address will not be published. Required fields are marked *

*