AUDUSD LOSS

AUDUSD LOSS
9th August 2017 contacttf
The Ichimoku Cloud, also known as Ichimoku Kinko Hyo, is a versatile indicator that defines support and resistance, identifies trend direction, gauges momentum and provides trading signals. Ichimoku Kinko Hyo translates into “one look equilibrium chart”.

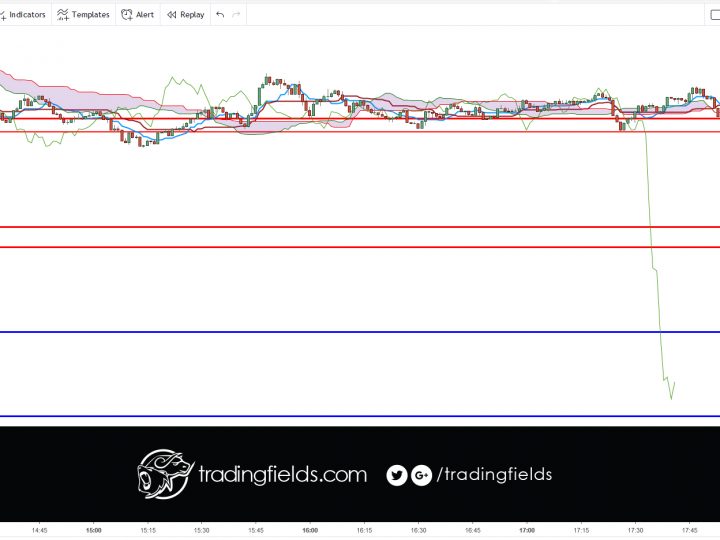
Again, I was late into $audusd. The price returned back near the previous resistance area. I am cautious about the sell/short potential because of the Ichimoku cloud.

Price moved in a channel for some time, It was interesting watching price bounce within this zone.

I made a poor decision, I moved my stop down. My position got filled.

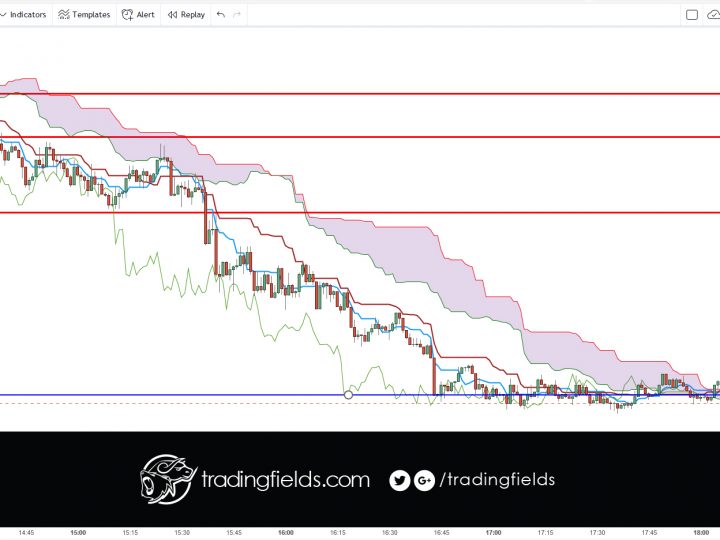
After trade analysis
I moved the stop prematurely, the chart shows the large drop missed.


The Relative Strength Index (RSI), developed by J. Welles Wilder, is a momentum oscillator that measures the speed and change of price movements. The RSI oscillates between zero and 100. Traditionally the RSI is considered overbought when above 70 and oversold when below 30.

0 Comments

Leave a reply

Your email address will not be published. Required fields are marked *

*