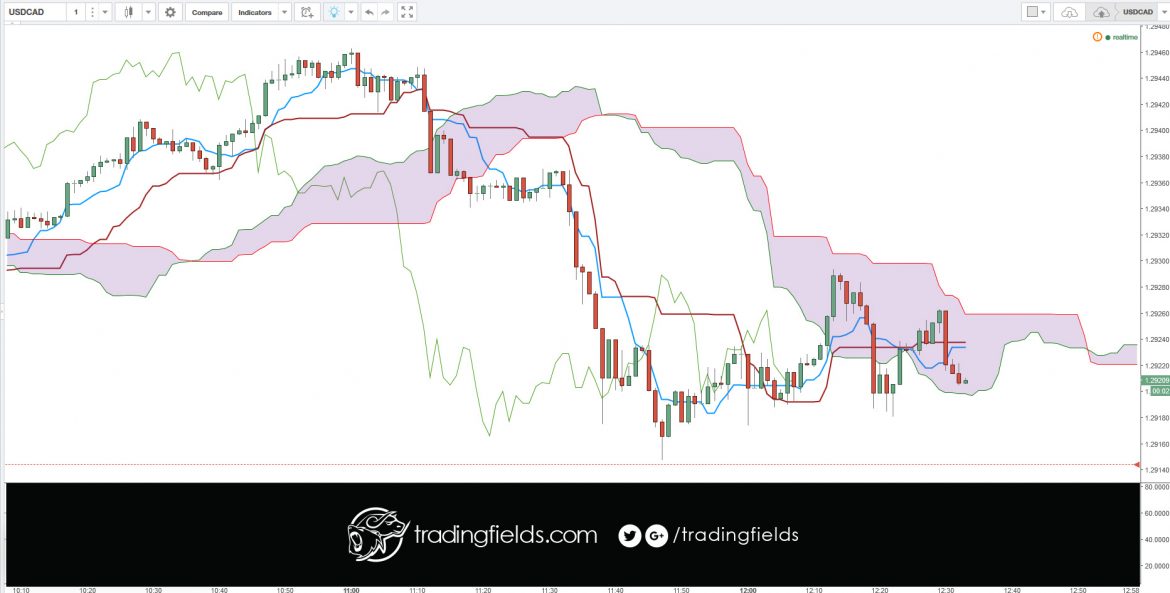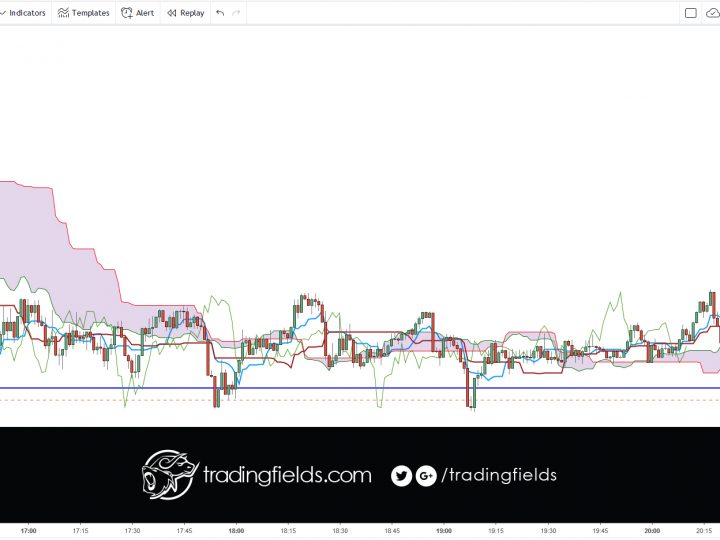
USDCAD was closed out breakeven, after an epic fall from identified resistance point.
1. I got off to a bad start. I entered later than I would normally
2. I did not follow my system [I should still be in on this trade in Profit had I followed my strategy].
I closed out because the market would not make sense to me. No real data to make this type of downward impact. Sometimes, we just need to accept the unexpected. My stop was never triggered.


